

Bitcoin is trying to stabilize after almost a year of losses. The world's largest cryptocurrency, which reached its all-time high of US$ 126 thousand in October 2025, has fallen more than 50% since then and dropped to US$ 58 thousand at the end of June 2026 — the lowest level in 21 months.
The pressure came from a combination of factors: record withdrawals from spot Bitcoin ETFs, frustration with interest rate cuts in the United States, and sales by corporate treasuries. The market sentiment gauge remains in fear territory.
In this scenario, one catalyst is gaining traction on investors' radar: the progress of Clarity Act (Digital Asset Market Clarity Act), the bill that promises to finally define who regulates the crypto market in the U.S. The proposal has already passed the House and was approved by the Senate Banking Committee in May 2026, although it still faces hurdles to reach the floor. For many, clear regulation is the missing piece to reignite risk appetite — and, combined with the Fed's decision at the end of July, it could mark the cycle's inflection point.
But after all: will Bitcoin rise or fall from here? We have gathered the most talked-about analyses from the leading traders of the moment. Opinions are divided — and the US$ 67 thousand level appears as the major dividing line between a recovery and a new drop. Check it out.
Bitcoin price analyses today
1. Ali Charts: the "macro bottom" and the temptation of patterns that have always worked
Among the market's more technical voices, Ali Charts (@alicharts) builds the most elaborate argument for those who believe the worst is already over. He argues that a "macro bottom" is forming, supported by a "technical trio" that, according to him, marked all the major cycle bottoms: the monthly RSI falling to around 43,65, the Chande Momentum Oscillator near -71, and the price testing the 50-month moving average. His recommendation is direct: "Shifting the focus from short positions to spot BTC accumulation offers a highly favorable risk-reward ratio at these levels."
The strength of the reasoning lies in historical repetition — the same signals would have preceded rallies of 8.300% (2015), 1.911% (2019), and 675% (2022). But this is precisely where the reader needs to tread carefully. Three correct calls make a small sample, and patterns that "always worked" tend to be selected after they worked. It is seductive analysis, not prophecy.
In his favor is his honesty: Ali Charts does not hide that on-chain metrics could still drag the price into the US$ 40 thousand–US$ 50 thousand range before a recovery. This caveat sets him apart from analysts who only see upside. Even so, accepting his invitation means buying in the middle of a drop — the classic "falling knife."
Sentiment: bullish · View analysis on X
2. Crypto Patel: the mirror of 2022 and the US$ 116 thousand target
Crypto Patel (@CryptoPatel) is betting everything on a historical parallel. "Bitcoin is flashing a signal we haven't seen since November 2022", writes, referring to a strong weekly bullish divergence. In his view, the last time this setup appeared, BTC rose more than 100% in about 150 days — which would put the coin "on track for US$ 116 thousand before November 2026".
It is an encouraging thesis, but weak at its foundation. The entire projection rests on a single previous occurrence, and the author himself acknowledges the condition by saying "if history repeats itself." Bullish divergences are, in fact, a respected technical signal, but turning an isolated 2022 case into a price forecast for 2026 gives a single data point the weight of a rule. It works as a sign of a reversal — not as a guarantee of a target.
Sentiment: optimistic
3. Ted (Ted Pillows): the pragmatism of someone who trades level by level
Amid grand predictions, Ted (@TedPillows) stands out for his measured tone. He celebrates that "BTC has reclaimed the US$ 65 thousand level" and points to the next resistance between US$ 67.500 and US$ 68 thousand. If that ceiling falls, he says, Bitcoin "could surge another 5% to 6% very quickly".
There is no promise of US$ 150 thousand here, nor a warning of apocalypse — just a conditional and verifiable reading: if it breaks such level, then such move. It is the kind of analysis that ages well, because it does not bet on a single outcome. The counterpoint is that it says little about the broader direction of the market: it is a short-term map, useful for traders, but insufficient for those who want to know where the cycle ends.
Sentiment: cautiously optimistic · View analysis on X
4. Michaël van de Poppe: one of the most respected names asks for patience
A leading analyst in the crypto market, Michaël van de Poppe (@CryptoMichNL) sees a bullish trend, but keeps enthusiasm in check. Bitcoin reached its highest price in more than a month, he notes, "without accelerating yet." The reason, according to him, is structural: it needs to break last month's US$ 67 thousand high, since "there is a large gap up to US$ 73 thousand from there". If that happens this month, the chart would form a strong monthly bullish engulfing and, in his words, "the bottom would be confirmed".
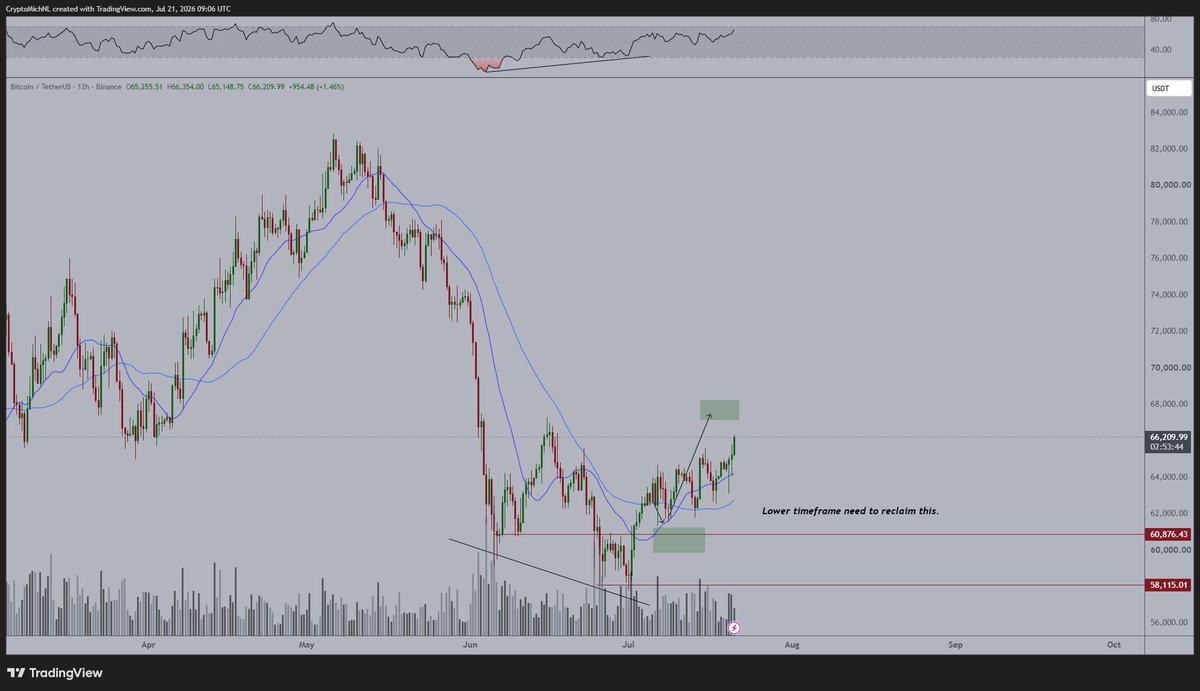
Coming from an analyst with an established track record and reputation, the opinion carries more weight — and the take follows market logic, not just rhetoric. The observation about the "gap" up to US$ 73 thousand is relevant: regions with no prior trading tend to be crossed quickly when the price reaches them. Even so, van de Poppe is the first to make everything conditional on a breakout above US$ 67 thousand — without it, the optimistic scenario simply does not activate. It is optimism with a safety lock.
Sentiment: cautiously optimistic · See analysis on X
5. Titan: the Ichimoku "cloud" and the same magic number
Titan (@Washigorira) offers a purely technical reading based on the Ichimoku indicator. He notes that "entering the Kumo triggered higher volatility" — the Kumo, or "cloud," is the area of the indicator that acts as a support and resistance field. A reclaim of US$ 67.290, he says, "could open the door to the upper limit of the cloud".
Translated for the non-technical reader: Bitcoin entered a region of indecision, and breaking out of it to the upside would unlock room to rise. It is a sober analysis, with no "to the Moon" narrative or crash warning. The revealing detail is the number: once again, the price’s destination orbits around US$ 67 thousand, the same level cited by practically all the other analysts.
Sentiment: neutral to optimistic
6. CryptoReviewing: shorts were liquidated — but the math still does not add up
CryptoReviewing (@CryptoReviewing) starts from a concrete fact: BTC "just climbed from US$ 63.500 to US$ 66.900, liquidating US$ 217 million in short positions". In other words, those betting on a drop were caught off guard and forced to buy, which pushed the price even higher — the classic "short squeeze."
What sets this analysis apart is its balance. Instead of selling only euphoria, the author shows both sides of the liquidity map: although the US$ 67 thousand–US$ 69 thousand range may be "swept" to the upside, he acknowledges that the US$ 61 thousand–US$ 66 thousand region concentrates larger liquidation orders, which makes it "the highest-probability zone to be visited next". It is rare to see a short-term profile admit that the most likely immediate path is downward. That honesty gives credibility to the rest of the reading.
Sentiment: neutral/mixed · See analysis on X
7. ardizor: the drama of the "bottom still to come" and the precision no one has
Few posts capture the crypto-influencer script better than that of ardizor (@ardizor). He warns: "THE MOST PAINFUL PART HASN'T HAPPENED YET. The bottom is still to come." And lays out a six-stop path — US$ 64 mil → US$ 68 mil → US$ 42 mil → US$ 95 mil → US$ 126 mil → US$ 150 mil — sustained by the idea that "the biggest gains in cryptocurrency history always come after the most painful phase".
The underlying premise has support: capitulation before major rallies is a real market pattern. The problem is false precision. No one can predict six exact price reversals in sequence, and presenting this as a closed script turns analysis into spectacle. The final appeal — "turn on notifications or you'll understand why it was a mistake" — makes it clear that the metric that matters here is engagement, not accuracy. Read it for the general thesis (more pain before the rally), not for the numbers.
Sentiment: bearish in the short term, ultra-optimistic in the cycle · See analysis on X
8. Tracer (DeFi Tracer): bottom at US$ 55 mil, US$ 86 mil in September — and a revealing invitation
Tracer (@DeFiTracer) is categorical: "BTC still hasn't bottomed." For him, the real floor is between US$ 55 mil and US$ 59 mil and, after filling a "fair value gap" (FVG) and "resetting the structure," the price "shoots straight to US$ 86 mil by September".
The vocabulary is precise enough to sound authoritative — "FVG," "structure reset" — but, in practice, hard to verify: these are terms that describe almost any movement after it happens. The most important signal, however, is at the end of the post, when the author promotes a "free community." Content built to funnel followers deserves an extra layer of skepticism — the US$ 86 mil target in September looks more like a marketing hook than a well-founded projection.
Sentiment: bearish in the short term, optimistic afterward · See analysis on X
9. Crypto Tice: "the last line of defense" and the rhetoric of fear
Crypto Tice (@CryptoTice_) signs the bleakest warning on the list. "The signal that predicted every major Bitcoin crash has flashed again", he writes, recalling that from similar levels, BTC fell 51% in 2014, 46% in 2018, and 55% in 2022. With the 2026 Fibonacci level at US$ 67 mil, a 50% drop would take the price to US$ 42 mil. His verdict is blunt: "US$ 67 mil is the last line of defense."
Like the optimists who use the same method in reverse, he selects the three episodes in which the pattern worked. And the rhetorical construction is too clever to go unnoticed: "lose = US$ 45 mil; hold = this time is different" is a trap in which any outcome confirms the author. Even so, there is one point that cannot be dismissed — the level he defends, US$ 67 mil, is exactly the same one that the bulls point to as the trigger. Even dramatized, his number matters.
Sentiment: bearish/warning · See analysis on X
10. Alex Mason: the analysis that most calls for skepticism
No reading on this list requires as much caution as Alex Mason's (@AlexMasonCrypto). He opens by declaring: "I predicted this rally perfectly" — and claims to have called "all the major tops and bottoms of the last 15 years," from gold to oil.
The technical thesis even has logic: a descending channel that would treat the current bounce as a "fakeout", or false breakout. The problem is the surrounding context. Claims of perfect calls over 15 years are impossible to verify and work as authority bait; the invitation to "turn on notifications" reinforces that the goal is engagement, not analysis. The bearish reading may even be confirmed, but the reader should separate the chart from the marketing before taking it seriously.
Sentiment: bearish · See analysis on X
Conclusion: what is the overall sentiment among traders?
Putting all the voices side by side, the market picture is one of division with a common denominator. Most analysts — from convinced optimists, such as Ali Charts and Crypto Patel, to the cautious and more reliable ones, such as Ted and Michaël van de Poppe — believe that a bottom is near or has already been reached, with targets ranging from US$ 86 thousand to US$ 150 thousand in the coming months.
On the other side, the bears Crypto Tice and Alex Mason warn that the current bounce may be a trap and that losing support would open the way to US$ 42 thousand–US$ 45 thousand. And there is a "middle-ground" group — ardizor and Tracer — that combines the two scenarios: one more painful drop, to the US$ 42 thousand–US$ 59 thousand range, before the major recovery.
A reading filter is worth applying: not all voices carry the same weight. Measured and verifiable analyses, such as those by van de Poppe, Ted, and CryptoReviewing, deserve more attention than posts built on self-promotion and appeals for notifications, as in the case of Alex Mason, ardizor, and Tracer.
The point of convergence, however, is crystal clear: US$ 67 thousand is the number to watch. Optimists and pessimists cite the same zone as the line separating bottom confirmation from a new downward leg. Adding this to the advance of Clarity Act and the Fed's decision at the end of July, Bitcoin enters a decisive period — in which regulation and macroeconomics may weigh as much as the charts.
Important notice: this content is journalistic and informative and brings together public opinions from third parties. It does not constitute investment advice. Cryptocurrencies are extremely volatile assets, and traders' forecasts often do not come true. Do your own research and, if necessary, consult a certified professional before investing.


