


Day trading is a profession that many people make money in, but trading cryptocurrencies without a plan or knowledge is not the best way to start. For this reason, all traders will study crypto charts in search of a recognizable pattern to help them predict, to some extent, how the price of currencies will develop throughout the day. One of the most logical and consistent trading patterns is the ABCD pattern.
In this article, we will discuss:
What is the ABCD pattern?
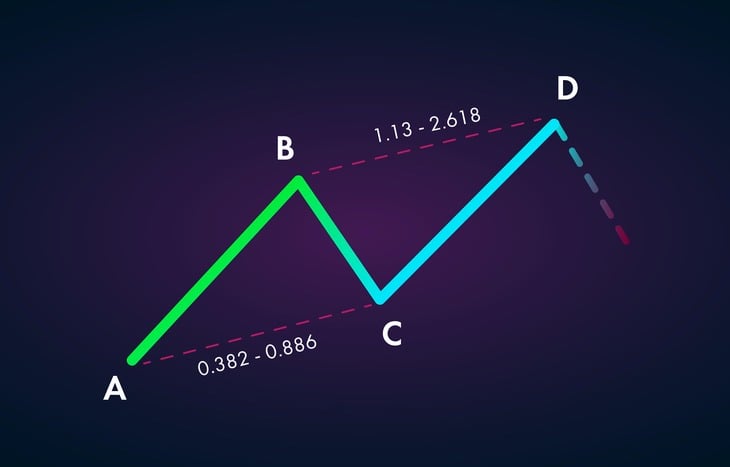
The ABCD pattern is a highly recognizable value pattern that has long been used in the stock market all over the world, every day. The main recognizable feature of an ABCD pattern is that the A to B leg (AB leg) corresponds to the C to D leg (CD leg) – in other words, AB ≈ CD. Leg B to C (leg BC), however, represents setbacks and value consolidation. These patterns can go both ways and therefore can be bullish or bearish. Depending on which it is, the investor will buy or sell at point D.
ABCD patterns aren't present on all stock charts, but most traders will argue that if someone digs deep enough, they can be found every day. The pattern is predictable and therefore considered good to follow for profit. However, as with any trade, this is never guaranteed.
When to use the ABCD pattern?
Thanks to its simplicity and the fact that most other patterns are based on it, the ABCD pattern is particularly good to use when starting a trade.
It is also known as the “afternoon pattern”, which means it starts at the end of the day. The investment entry point usually falls within the 14 pm window, which is understood to be between 13 pm and 15:30 pm. So it's also a great pattern to watch if you're a part-time trader, as it drops during lunch.
Tips for finding the ABCD pattern
A useful tip is that alerts can be set on platforms like Phemex for cryptocurrency trading or StocksToTrade for other stocks. They can alert you when the stock reaches a value you set, which is why it's so important to do your research in advance.
Not only will you know when to invest, but you will also be able to set the alert to sound when the value reaches the desired point, as per the ABCD pattern. In this way, you will never miss a good investment opportunity.
How to draw the ABCD pattern
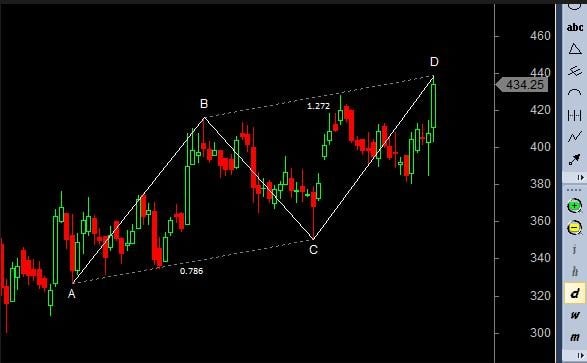
In the ABCD pattern, each letter represents a significant high or low in the price shown on the stock chart, meaning it is relatively easy to find and follow. Each leg of the pattern (letter to letter) is generally within a range of 3-13 bars/candles. If the range of bars is smaller, it indicates that the trader must look for a longer period of time to find the pattern.
When the pattern is located, the Fibonacci retraction tool is used to draw the legs between the different points (A to D). This tool helps identify the support and resistance areas of the bull and bear turns, as well as measuring the legs, thus helping to predict the outcome. It also tells investors when to buy and sell. Knowing that the AB leg must be the same length as the CD leg, an investor can use this tool to identify where the new lows and highs will fall and invest accordingly.
How to use the high and low ABCD patterns
When is an ABCD pattern optimistic?
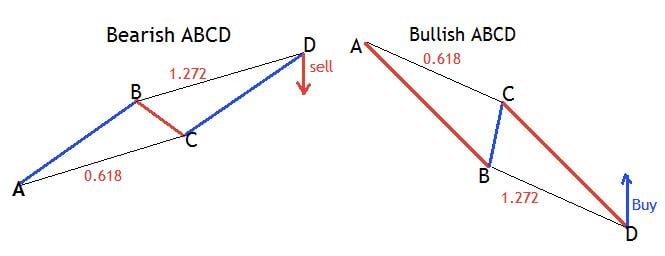
For a bullish ABCD, the investor will look to buy at point D. The pattern can be divided as follows:
- A: The point A is at a significant high.
- B: The point B is at a significant low. Although the stock value may decrease or increase during leg AB, there cannot be any point value greater than A and no point less than B. This is because to adhere to the ABCD standard, A and B must be the highest and respective ones. lowest points in leg AB.
- C:O point C must be lower than point A, but not lower than point B. It is known as the second low point.
- OF point D must be smaller than point B. This marks a new low for the value. As with leg AB, and for the same reasons, there can be no points greater than C and no points less than D on leg CD. The investor should aim to achieve a minimum target profit at point B.
When is an ABCD pattern bearish?
For a bearish ABCD, the investor will look to sell at point D. The pattern can be divided as follows:
- A: The point A is a significant low.
- B: The point B is a significant high. As with the bullish ABCD, but working in the opposite direction, there can be no points less than A and no points greater than B on leg AB.
- C:O point C must be higher than point A. Again, there can be no highs above B and no lows below C in leg BC.
- OF point D must be greater than point B. There can be no points less than C and no points greater than D on leg CD. The investor will sell when the CD leg coincides with the AB leg.
How to make money with the ABCD pattern?
It's great to know how to draw the ABCD pattern, but if an investor doesn't know how to use it, then it doesn't have any meaning for him. Making money with ABCD pattern trading is quite simple and includes basic math. Without doing these calculations first, it can be easy to overestimate / underestimate where your D point will land on the ABCD chart pattern and therefore your profit.
In these circumstances, an investor will wait too long or jump too early, thus missing the upper limit on the stock's earning capacity. In an environment as fast-paced as stock trading, this can happen very quickly, so it might be beneficial to set an alert for this as well.
To make money with the ABCD standard, the following must be considered:
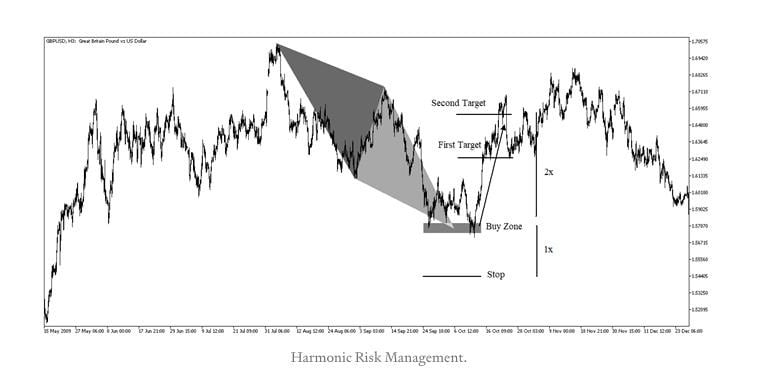
- The risk: to calculate the risk of an investment using the ABCD pattern, we must first note the values of points A and B on the graph. For a bearish pattern, the investor must subtract the value of A from B; for a bullish pattern, B of A. This will provide the risk value per share. The risk indicates how much should be considered acceptable to lose, as well as how much a investor must expect to win . The expected gain should be 3:1 of the risk value, while the acceptable loss should be the risk value per share below the investment per share.
- When to invest: For a bearish pattern, the trader should measure the AB leg and then use that measure to compare it to the CD leg. When the legs match, it indicates the best time to buy. For a bullish pattern, the investor should aim to invest in point C.
- When to sell: for a bearish pattern, the investor should aim for a profit target at point B; however, it can also go up or down. For a bullish pattern, the trader will measure the AB leg and sell when the CD leg matches.
Of course, there will be times when the point of sale does not reach the expected point, falling short or surpassing it. This is where the investor will make an informed decision based on the market and the risk he is willing to take. This could mean selling with a 2:1 risk to reward, as opposed to a 3:1, or if they think they can keep going up, sell some of the stock hard and let the rest run. The important thing, however, is not to incur large losses.
In addition to the A, B, C, and D points of the ABCD chart pattern, there are two other factors that can help increase your chances of profit:
- Volume: the volume of business it can also give good indications of what an action will do. If the trading volume is high, it is a good sign for investors and could be an indicator that the stock will reach or even surpass the selling point. Also, if the stock is in a hot sector like DeFi , has a low float or has news trends, this can increase the volume and lead to a successful ABCD pattern.
- Multi-day graphics: As the ABCD pattern is an intraday pattern, it is also important to look at the multi-day charts of the asset you wish to invest in. Check to see if these patterns have emerged in recent days. Were the ABCD pattern rules followed? Was the expected point of sale reached, exceeded or did it fall short? This information can be helpful in deciding whether and how much to invest.
How to avoid big losses with the ABCD pattern?
The ABCD pattern indicates what the risk is and follows a clear pattern and therefore should be used as a guide on when to sell, whether to take a profit or cut losses. This trading pattern has been around for a long time and therefore it has been well tested. Of course, there will be times when an exception to the pattern confirms the rule, but to avoid big losses, it's best to follow it.
It is also worth remembering that the value can increase again at the end of the day. This is another reason why an investor should not take the risk of insuring when the value falls beyond the investment point plus the risk value.
The value is never guaranteed to go up again, so selling at the right spot is critical. If the value starts going up again, the investor can simply buy later, hoping that this time the stock will hit the target and become profitable. Using this method eliminates the threat of large losses and, if you allow it, offers the opportunity to recoup those smaller losses and make a profit.
Conclusion
The ABCD pattern, although varied, is one of the most reliable and established patterns in trading. It can be used for both downtrend and uptrend investments and provides the information you need to avoid heavy losses. Although these patterns provide information to investors, it is still essential that they do their own research before investing, as markets can be affected by a multitude of external factors.
However, the ABCD pattern is a great starting block for new investors and a key you will use throughout your trading career. Not only that, but as most investment patterns are originally based on this one, it equips the investor with the tools to learn other patterns as well. In the end, however, no pattern is 100% accurate 100% of the time and therefore the ABCD pattern is by no means foolproof and should be used critically.