


In this article, we will discuss:
What is Standard Deviation?
The standard deviation represents an statistical measure that quantifies the variation or dispersion of the values of a given set of data around the mean. This calculation is carried out by extracting the square root of the variance, which makes it easier to understand the extent to which each individual value differs from the set average.
In practice, a data set with values widely dispersed around the mean will result in a high standard deviation. This indicates that the greater the dispersion of the data, the greater the standard deviation value.
Benefits
- The standard deviation provides a quantitative analysis of the dispersion of the data compared to the ensemble mean.
- It is determined through the calculation of the square root of the variance.
- In the financial sphere, standard deviation is often used as an indicator of the risk associated with a given asset.
- Assets with high volatility have a high standard deviation, while stable assets, such as shares of consolidated companies (blue chips), tend to have a low standard deviation.
However, a limitation of standard deviation is its interpretation of all forms of uncertainty as risk, including those that may result in returns above the average.
What is the Function of Standard Deviation?
In the financial context, standard deviation is used as a statistical metric that, when applied to the annual rate of return on an investment, reveals its historical volatility.
A higher standard deviation in an asset indicates greater variability between its individual prices and the average, suggesting a wider price range. Thus, assets with greater volatility, such as certain stocks, have a higher standard deviation, while those considered more stable, such as blue chip stocks, have a lower standard deviation.
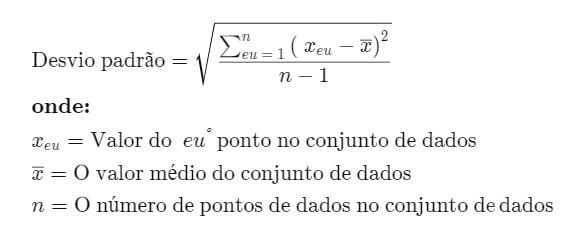
Standard Deviation Formula
The calculation of standard deviation is carried out by obtaining the square root of a value that is determined by comparing each data point with the general average of data from a given population. The formula is:
Procedure for Calculating Standard Deviation
To calculate the standard deviation, follow the process below:
1. First, the arithmetic mean of the data is determined by adding up all the values and dividing the result by the total number of data points.
2. Then, the difference between each data point and the average is calculated, which results in the individual variation of each point.
3. The next step is to square each of these variations.
4. After that, all squared variations obtained are added together.
5. This total is then divided by the total number of data points minus one.
6. Finally, the square root of the result obtained in the previous step is extracted.
Uses of Standard Deviation
Standard deviation is extremely relevant in the context of investments and trading, as it offers an accurate measure of market and financial asset volatility, contributing to the anticipation of yield trends. In the context of investments, for example, an index fund that has a reduced standard deviation compared to its reference index demonstrates that it is fulfilling its purpose of replicating the index's behavior.
On the other hand, aggressive growth funds are expected to show a higher standard deviation compared to relevant market indices, as their managers adopt bolder strategies in an attempt to achieve higher-than-average returns.
However, a smaller standard deviation is not necessarily more advantageous, as everything depends on the nature of the investments and the investor's predisposition to risk. When considering standard deviation in their portfolios, it is crucial that investors evaluate their volatility tolerance and long-term investment objectives. Investors with a more aggressive profile may prefer investment options with greater volatility, while those with a more conservative profile may seek less volatile alternatives.
Standard deviation is one of the fundamental metrics for risk assessment, widely used by financial analysts, portfolio managers and investment consultants. Financial institutions often disclose the standard deviation of mutual funds and other financial products, providing a clear view of how returns vary from the expected average. As it is an easy-to-interpret indicator, this statistic is regularly reported to clients and investors.
Standard Deviation vs. Variance
Variance is obtained by first averaging the values of a data set, subtracting that average from each value individually, squaring those differences, and finally squaring the average of those values. The standard deviation, in turn, corresponds to the square root of this variation. These procedures can be carried out efficiently with the help of software such as Excel.
The variation quantifies the amplitude of the dispersion of the data in relation to the average value. The greater the variation, the greater the dispersion between data values, indicating the possibility of greater distances between one value and another. If the data values are closer to each other, the variation will be smaller. However, the interpretation of the variation can be more complex, as it represents a quadratic value, which may not be easily comparable with the original values in the data set.
The standard deviation, on the other hand, tends to be more intuitive and applicable, being expressed in the same unit of measurement as the original data, which does not necessarily occur with variation. With the standard deviation, it is possible to identify whether the data follows a normal distribution or presents another form of mathematical relationship.
In a normal distribution, approximately 68% of the data lies within one standard deviation of the mean. Larger variations lead to more data outside this range, while smaller variations indicate that more data is close to the average.
Advantages and Disadvantages of Standard Deviation
Benefits
Standard deviation is a widely recognized and used measure of dispersion. Due to its familiarity among analysts and professionals from different areas, such as investments and actuarial science, this metric is often chosen for analysis.
This measure takes into account all observations in the dataset, offering a complete analysis. Unlike other measures that focus only on the most extreme values, standard deviation considers each data point, providing a more comprehensive and accurate view of dispersion.
It is possible to combine the standard deviation of two distinct data sets using a specific formula for combined standard deviation, something that does not apply to other measures of dispersion. Furthermore, the standard deviation can be integrated into additional algebraic calculations, differentiating it from other forms of statistical analysis.
Disadvantages
When using standard deviation, you should keep a few considerations in mind. This measure does not explicitly indicate how far a value is from the mean, but rather compares squared differences, an important nuance in understanding the dispersion of data relative to the mean.
Values very far from the mean, or outliers, significantly impact the standard deviation, mainly because the differences are squared, increasing the effect of these extreme points in the analysis.
Lastly, manually calculating standard deviation can be challenging, requiring several complex steps that increase the risk of errors. This difficulty, however, can be minimized with the use of advanced computational tools, such as the Bloomberg terminal.
Standard Deviation Examples
Consider a set of data composed of the values 5, 7, 3 and 7, whose sum is 22. To find the average, this total is divided by the number of observations, which in this case is four, resulting in an average of 5,5. Therefore, we have a mean (\(x̄\)) of 5,5 and a total number of data (\(N\)) equal to 4.
To calculate the variance, the mean of each value in the data set is subtracted, obtaining the differences -0,5, 1,5, -2,5 and 1,5. These differences are then squared, resulting in 0,25, 2,25, 6,25, and 2,25, respectively. The sum of these squared values is 11, which, divided by \(N-1\) (in this case, 3), results in a variance of approximately 3,67.
The square root of this variance gives us the standard deviation, which is approximately 1,915.
Taking Apple (AAPL) shares as an example over five years, with annual returns of 88,97% in 2019, 82,31% in 2020, 34,65% in 2021, -26,41% in 2022 and 28,32 .2023% in 41,57, the average return over these five years is XNUMX%.
Subtracting the average return for each year, we obtain 47,40%, 40,74%, -6,92%, -67,98% and -13,25%, respectively. After squaring these values, we have 22,47%, 16,60%, 0,48%, 46,21% and 2,42%. The sum of these squared values is 0,882. Dividing this value by 4 (\(N-1\)) we obtain a variance of 0,220.
The square root of this variance is the standard deviation, resulting in 0,469 or 46,90%.
Conclusion
Standard deviation emerges as a fundamental statistical tool for measuring the dispersion of a set of data in relation to its mean. Through practical examples, such as the performance of Apple shares or a simple set of numbers, it was demonstrated how to calculate both variance and standard deviation, elucidating the relevance of each measure in interpreting volatility and data dispersion.
Understanding standard deviation is crucial for several areas, including finance, scientific research and engineering, as it offers insights into the consistency or variability of analyzed data. A high standard deviation indicates a greater dispersion of values around the mean, suggesting volatility or inconsistency, while a low value suggests that the data is more clustered around the mean, indicating stability.
FAQ
What does a high standard deviation indicate?
A high standard deviation signals that the values in the data set vary significantly from the mean, demonstrating considerable dispersion of the data. On the other hand, a low standard deviation indicates that the data is more concentrated around the mean.
What information is obtained through the standard deviation?
Standard deviation provides a measure of dispersion for a set of data, indicating whether values are close to or far from the mean. In normal distributions, it allows you to understand how spread out the data is in relation to the mean.
How to quickly determine standard deviation?
A visual analysis of the data distribution can indicate whether the dispersion is wide or narrow. Distributions with greater dispersion have higher standard deviations. For specific calculations, software such as Excel has functions dedicated to calculating the standard deviation, making it easier to obtain this measurement.
How is standard deviation calculated?
The standard deviation is calculated from the square root of the variance. This process involves determining the mean of the data set, calculating the differences between each data point and the mean, squaring these differences, summing the results, dividing by the number of observations minus one, and finally extraction of the square root of the result.