


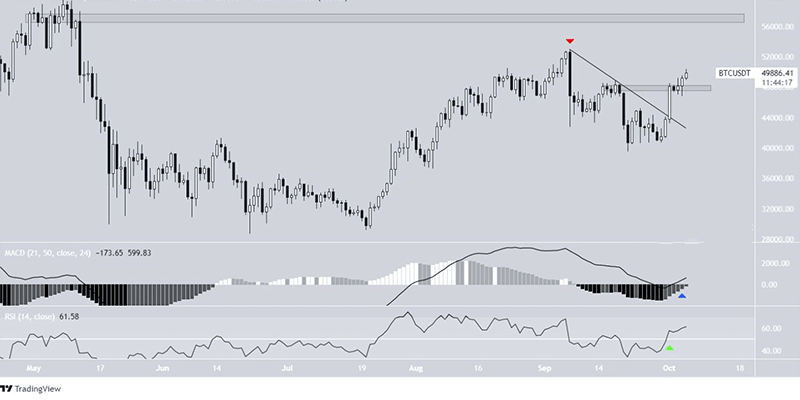
- Bitcoin (BTC) exited a downside resistance line and rebounded to the $47.800 resistance area afterwards.
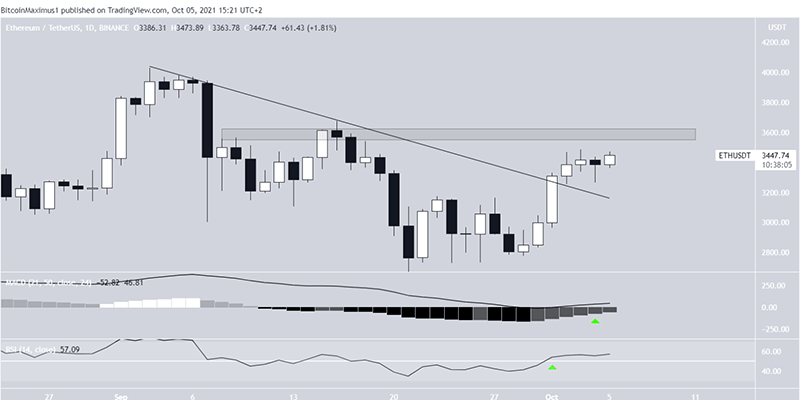
- Ethereum (ETH) also exited a downside resistance line but is trading below the $3.650 resistance area.
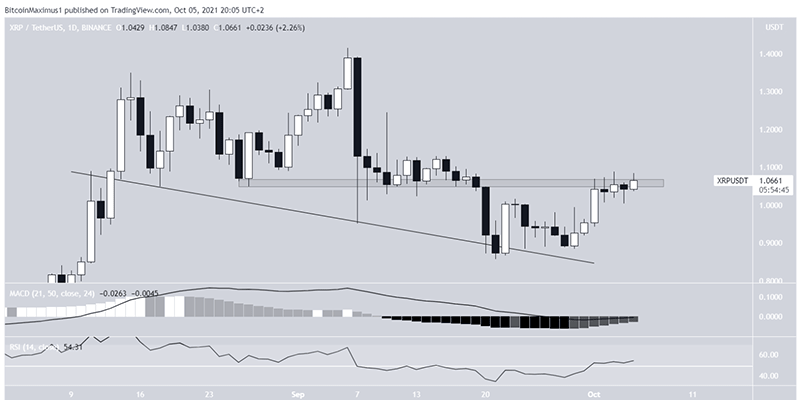
- XRP (XRP) follows a downward support line and trades below the $1,07 resistance area.
- Monero (XMR) has not yet breached its downside resistance line.
- Terra (LUNA) hit a new all-time record on October 4th.
- SHIBA INU (SHIB) exited the $0,000009 resistance area and increased 115% in two days.
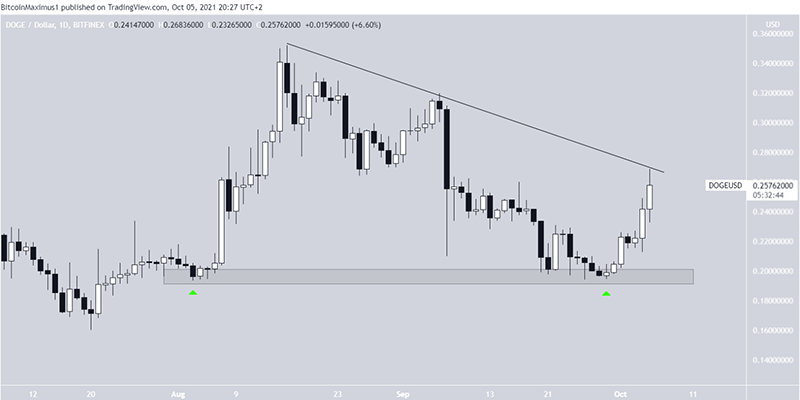
- Dogecoin (DOGE) is still decreasing along a downward resistance line.
In this article, we will discuss:
BTC
On Oct 1, BTC broke out from a descending resistance line. This put an end to the downward movement that had been occurring since September 4th (red icon). Therefore, it is possible that the downtrend has ended and BTC is now going higher.
On October 3rd, the BTC also crossed the $47.800 area, further supporting this possibility. The next resistance area is at $56.200.
Technical indicators also support the continuation of the upward movement. The MACD, which is created by multiple moving averages (MA), has crossed into positive territory. Also, its histogram is almost positive (blue icon), a sign that the short-term trend is accelerating faster than the long-term one.
Also, the RSI has gone from 50 (green icon). The RSI is a momentum indicator and its crossover above and below 50 can be seen as the determinant of an uptrend or a downtrend.
The last time the RSI crossed above 50 was on July 23, just after the current bullish move began.
ETH
The movement of ETH is relatively similar to that of BTC. The token also exited a downward resistance line on October 1st, ending the previous downward movement.
However, unlike the BTC, it has not yet moved above its nearest resistance area of $3.650. Once it is able to do that, it will likely increase towards the September highs of $4.027.
The MACD and RSI readings are identical to those of the BTC, supporting the continuation of the upward movement.
XRP
XRP has been declining along a descending support line since the 13th of August. More recently, it bounced off the line on Sept. 21 and started the current upward movement.
While this could be seen as a sign of a reversal of the uptrend, the token is still trading below horizontal resistance at $1,07.
MACD and RSI are providing readings similar to ETH and BTC. However, MACD is still negative. This means that although the short-term MM is moving up at a faster rate than the long-term MM, it is still below it. Therefore, the trend cannot yet be considered bullish.
XMR
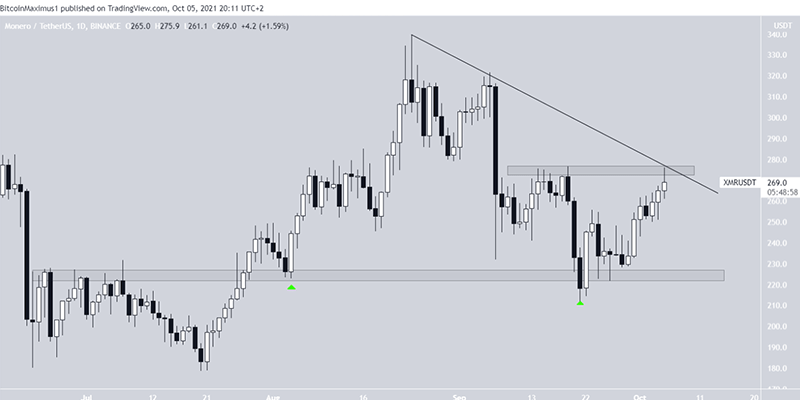
The XMR has been decreasing along a downward resistance line since September 24th. The fall culminated in a low of $212 on September 21st. After that, the token bounced (green icon) and has been moving up ever since.
The bounce validated the $225 area as support as a bullish move was initiated at the same level on August 4th (green icon). Therefore, as long as the token is trading above this area, the trend can be considered bullish and jumps are likely to occur if the area is retested.
However, XMR is still following a downward resistance line and facing resistance at $275. To move towards its August highs, it first has to clear this strong confluence of resistance levels.
MOON FABRIC
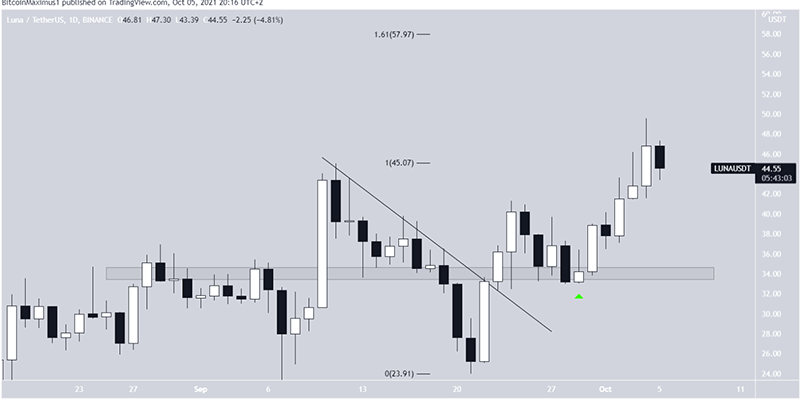
LUNA has been moving higher at an accelerated rate since September 29, when it validated the $33 level as support. Several days earlier, it broke a descending resistance line and moved above the area for the first time.
The fact that the token exited both diagonal and horizontal resistance levels is a testament to the strength of the current trend.
On October 4, the token hit a new high of $49,54.
If the upward movement continues, the next resistance area would be at $58. Resistance is created by the 1,61 External Fib retracement resistance level when measuring the previous decline. When currencies are at a higher level, external Fib retracements are often used due to lack of aerial resistance.
For this reason, the upward movement can even become parabolic.
shib
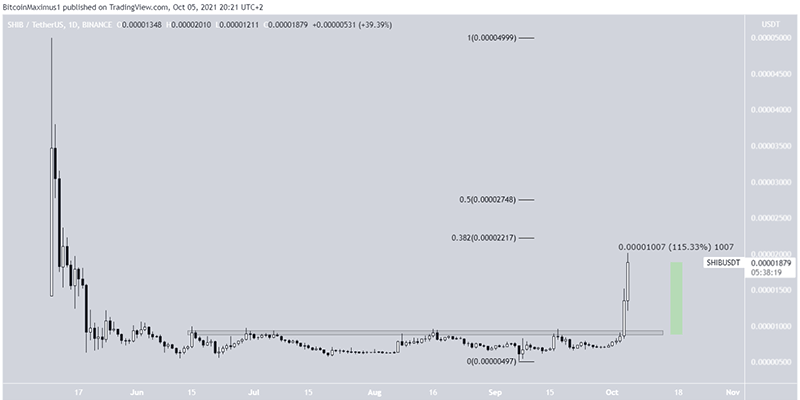
In the period from June 13th to October 4th, the SHIB consolidated below the horizontal resistance area of $0,000009. On October 4th, it broke out in the middle of a huge bullish candlestick.
The fact that the token consolidates for three months before it bursts is a sign that the subsequent upward movement could be very significant.
In a period of just two days, the token has increased by 115%.
However, it is approaching Fib's first retracement resistance level at $0,000022. Since the token has not been redone since the break, a short term bounce and retraction would be a common occurrence.
After that, the next resistance area would be $0,000027.
DOGE
The DOGE has been decreasing along a downward resistance line since the 16th of August. The bearish move led to a low of $0,19 on September 29th. A leap followed later.
The jump is significant as it validated the $0,195 area as support. The same area was the catalyst for an upward movement on August 3rd.
However, the trend cannot be considered bullish until the DOGE exits its downside resistance line.